How to Monitor Excel Data Automatically (Without Power BI or Complex Tools)
If you've ever spent your morning manually checking Excel files for critical values, anomalies, or threshold breaches, you know how tedious it can be. Whether you're monitoring sales data, inventory levels, financial metrics, or operational KPIs, the traditional approach of opening spreadsheets and scanning rows is time-consuming and error-prone.
The good news? You can monitor Excel data automatically without investing in expensive Business Intelligence platforms or learning complex programming languages. This guide will show you exactly how.
The Problem: Manual Excel Monitoring Doesn't Scale
Let's say you're a financial analyst tracking daily revenue across multiple product lines. Your data lives in Excel files updated throughout the day. You need to know immediately when:
- Revenue drops below critical thresholds (emergency alert)
- Key metrics show unusual patterns (warning notification)
- Performance targets are at risk (proactive monitoring)
The traditional workflow looks like this:
- Open Excel file every hour (or multiple times per day)
- Scan through rows looking for problems
- Manually check if values exceed thresholds
- Create charts to visualize trends
- Email stakeholders when issues are found
- Repeat tomorrow
This approach has serious limitations:
- Time-intensive: Takes 15-30 minutes per check, multiple times daily
- Human error: Easy to miss critical values in large datasets
- Delayed response: Problems discovered hours after they occur
- No historical context: Hard to see trends over time
- Doesn't scale: What works for one file breaks with ten files
Traditional Solutions (And Why They're Overkill)
When teams realize manual monitoring isn't sustainable, they typically explore these options:
1. Power BI or Tableau
Cost: $10-70 per user per month
Learning curve: Weeks to months
Setup complexity: Requires data modeling, relationships, DAX formulas
Power BI is incredibly powerful for enterprise reporting, but for simple threshold monitoring? It's like buying a Ferrari to drive to the corner store. You'll spend more time building dashboards than actually monitoring your data.
2. Custom VBA Macros
Cost: Development time
Learning curve: Requires programming knowledge
Maintenance: Breaks when Excel structure changes
VBA can automate Excel tasks, but it requires coding skills most business users don't have. And when the person who wrote the macro leaves the company? Good luck maintaining it.
3. Python Scripts with Pandas
Cost: Development + infrastructure
Learning curve: Programming required
Deployment: Needs hosting, scheduling, maintenance
Python is fantastic for data analysis, but writing scripts, setting up scheduled jobs, and maintaining infrastructure is a full-time IT project—not a quick solution for business users.
4. Zapier or Power Automate
Cost: $20-50+ per month
Limitations: No threshold logic, limited data analysis
Complexity: Requires multiple integrations
Workflow automation tools are great for connecting apps, but they weren't designed for sophisticated data monitoring with multi-level threshold rules.
The Simpler Solution: Purpose-Built Excel Monitoring
What if you could monitor Excel data automatically without any of that complexity? Here's what an ideal solution looks like:
- Upload your Excel file (or CSV, JSON, XML) in seconds
- Define thresholds with a simple interface (no formulas needed)
- Get instant alerts when values breach critical levels
- Visualize trends automatically with timeline charts
- View distribution patterns to spot anomalies
- No installation, no coding, no IT required
How to Monitor Excel Data Automatically: Step-by-Step
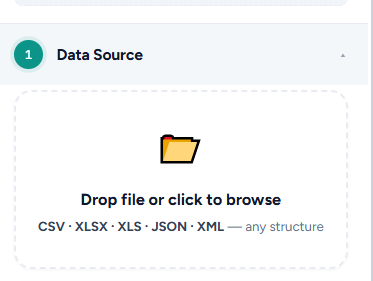
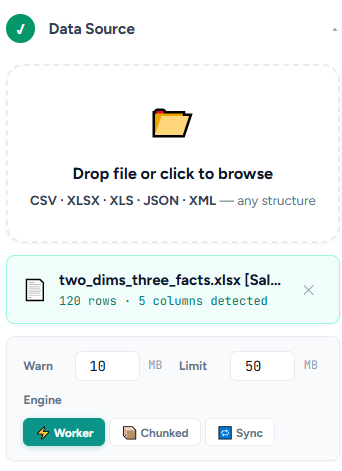
Step 1: Upload Your Data File
Start by uploading your Excel spreadsheet. The system should support:
- Excel (.xlsx, .xls)
- CSV files
- JSON data exports
- XML structured data
No preprocessing needed—just drag and drop your raw data file.
Step 2: Map Your Data Columns
Tell the system which columns contain:
- Dimensions: Categories like Product, Region, Date
- Facts (metrics): Numbers like Revenue, Units Sold, Delay Hours
The interface should auto-detect column types, so you're just confirming, not configuring from scratch.
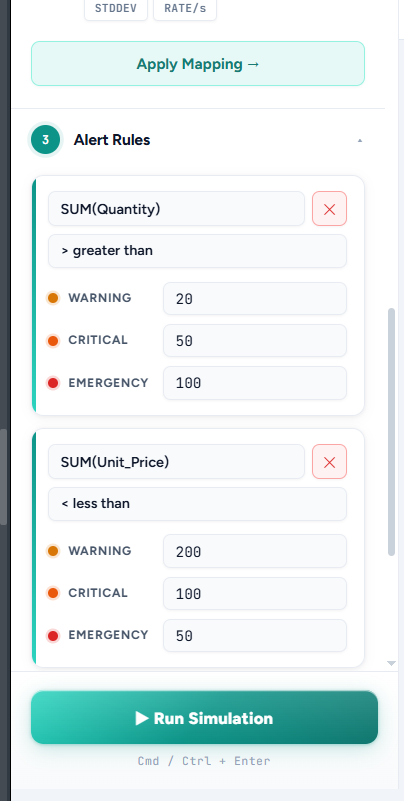
Step 3: Define Multi-Level Thresholds
This is where automatic monitoring gets powerful. Set three severity levels:
- Warning: "Hey, this needs attention soon" (e.g., inventory below 100 units)
- Critical: "This is getting serious" (e.g., inventory below 50 units)
- Emergency: "Act immediately" (e.g., inventory below 10 units)
Metric: Daily Revenue
Emergency: Less than $5,000
Critical: Less than $8,000
Warning: Less than $12,000
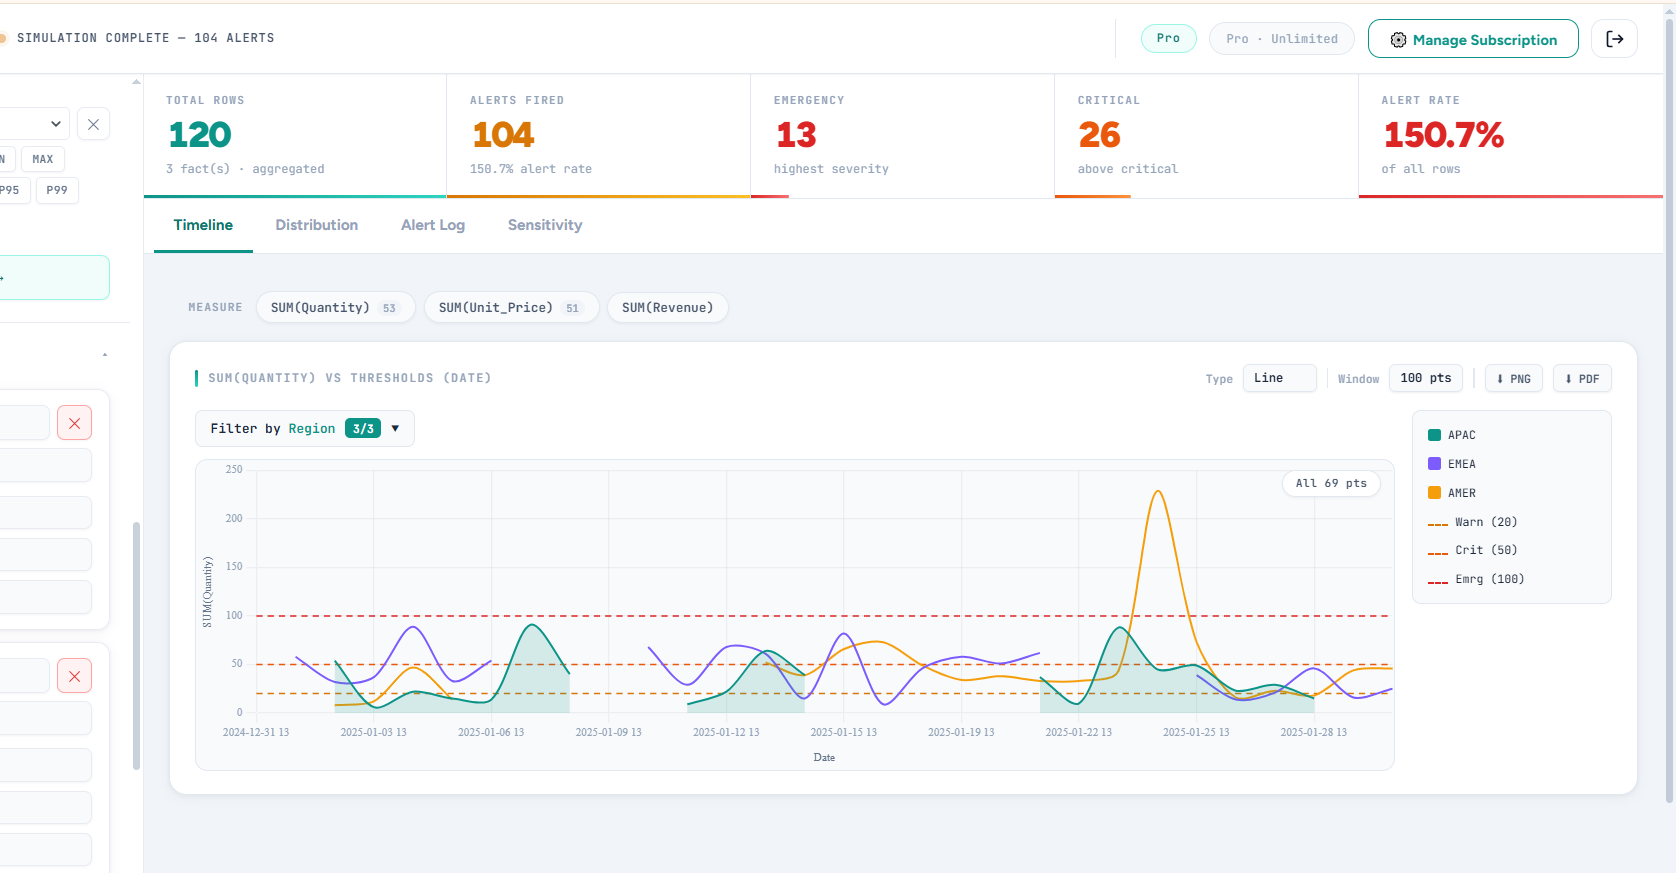
Step 4: Run Simulations to Monitor Your Data
Once configured, the system processes your data and identifies every row that breaches your thresholds. You'll instantly see:
- Alert log: Complete list of threshold breaches with severity levels
- Timeline view: When did alerts occur? What's the trend?
- Distribution charts: How are alerts distributed across categories?
- Peak times: When do most problems occur?
Step 5: Export and Share Results
Generate professional reports you can share with stakeholders:
- Export alert logs to CSV for analysis
- Download charts as PNG images
- Create PDF reports with executive summaries
Real-World Use Cases
Financial Monitoring
A CFO monitors daily cash flow across 15 business units. Emergency alerts trigger when any unit's balance drops below the critical threshold, preventing overdraft situations.
Inventory Management
A supply chain manager tracks stock levels for 500 SKUs. Warning alerts flag items approaching reorder points, while critical alerts identify stockouts requiring immediate action.
Sales Performance Tracking
A sales director monitors rep performance metrics daily. The system automatically identifies underperforming reps (critical threshold) and top performers exceeding targets.
Operational KPIs
An operations manager tracks customer service response times. Emergency alerts fire when average response time exceeds SLA commitments.
Benefits of Automated Excel Monitoring
Save 10+ hours per week: No more manual checking. Upload your file once and get instant insights.
Never miss critical issues: Automated threshold detection catches every breach, not just the ones you happen to notice.
Respond faster: Discover problems within seconds, not hours or days later.
Make data-driven decisions: Visualize trends and patterns that are invisible in spreadsheet rows.
No technical skills required: If you can upload a file and click buttons, you can set up automated monitoring.
Get Started with Automatic Excel Monitoring
Stop manually checking Excel files for threshold breaches. Start monitoring your data automatically with a purpose-built solution that requires zero coding, zero setup complexity, and zero expensive BI licenses.
Upload your Excel file, define your thresholds, and get instant alerts. No credit card required.
Frequently Asked Questions
Do I need to install anything?
No. Everything runs in your web browser. Upload your Excel file and start monitoring immediately.
What file formats are supported?
Excel (.xlsx, .xls), CSV, JSON, and XML files. If your data is in a spreadsheet or structured text file, it works.
Can I monitor multiple files?
Yes. Upload different files for different datasets, or combine multiple sheets from the same Excel workbook.
How often can I run monitoring checks?
As often as your data updates. Upload a new version of your file anytime and re-run the simulation to get updated alerts.
Is my data secure?
Yes. All data processing happens on secure servers with encryption in transit and at rest. You control who has access to your simulations.
Conclusion: Excel Monitoring Made Simple
You don't need Power BI expertise, programming skills, or expensive enterprise software to monitor Excel data automatically. With the right tool, you can upload a file, define thresholds, and get instant alerts—all in less time than it takes to manually scan one spreadsheet.
The question isn't whether you should automate Excel monitoring. The question is: how much longer will you keep doing it manually?